GUI Main Window

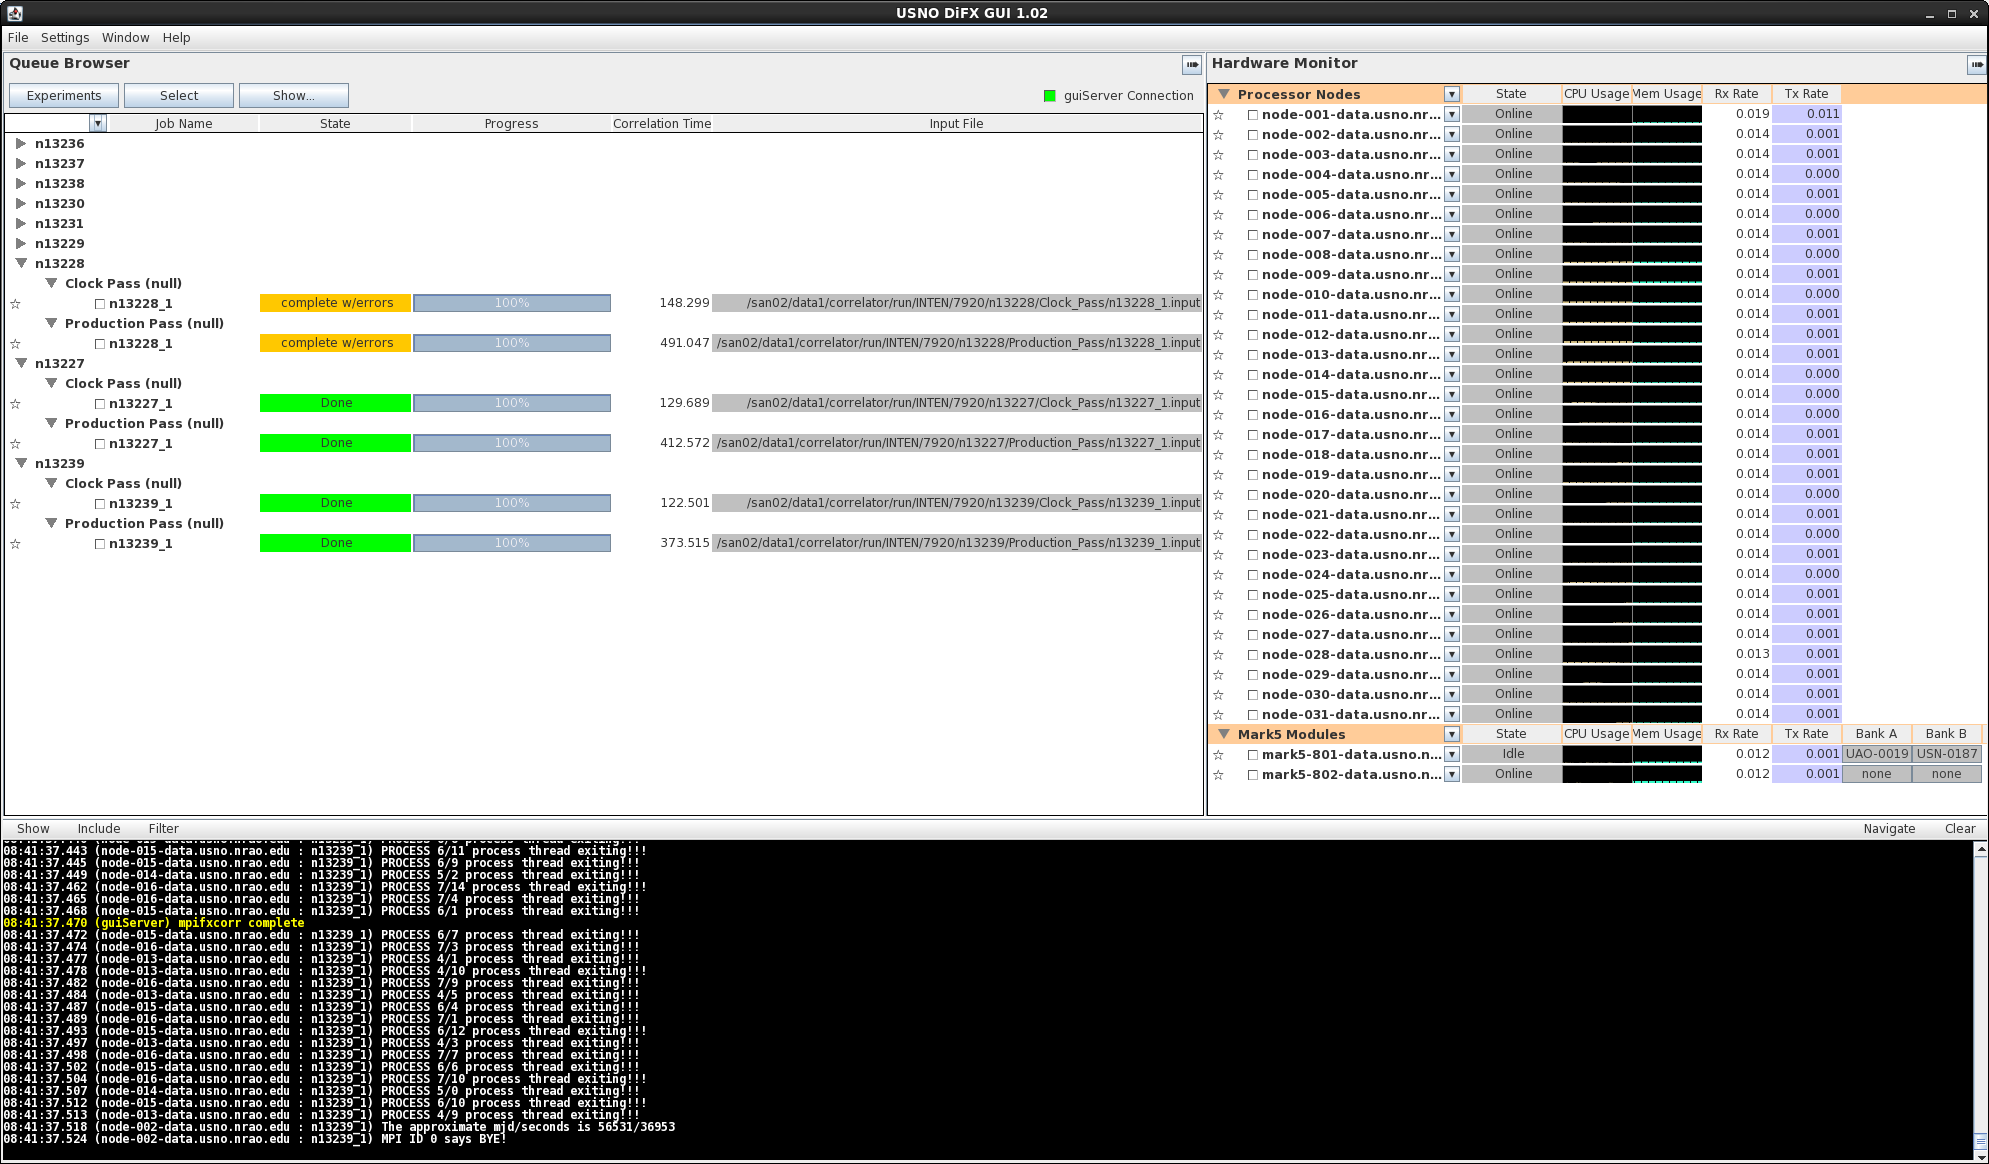
The DiFX GUI main window is the only window visible when the GUI
is first launched. It contains three components that
provide top-level information about the DiFX correlator
hardware, correlation jobs, and current correlation activities.
- The Queue Browser shows a list of correlation jobs and
their run status.
- The Hardware Monitor shows the status of the processing
nodes and Mark 5 units in the correlator.
- The Message Window displays messages produced by DiFX
software.
The dividers between the three components of the main window can
be moved around to allocate different fractions of the window
real estate to each (these changes, as well as changes in the
overall window size, will be remembered by the GUI settings file
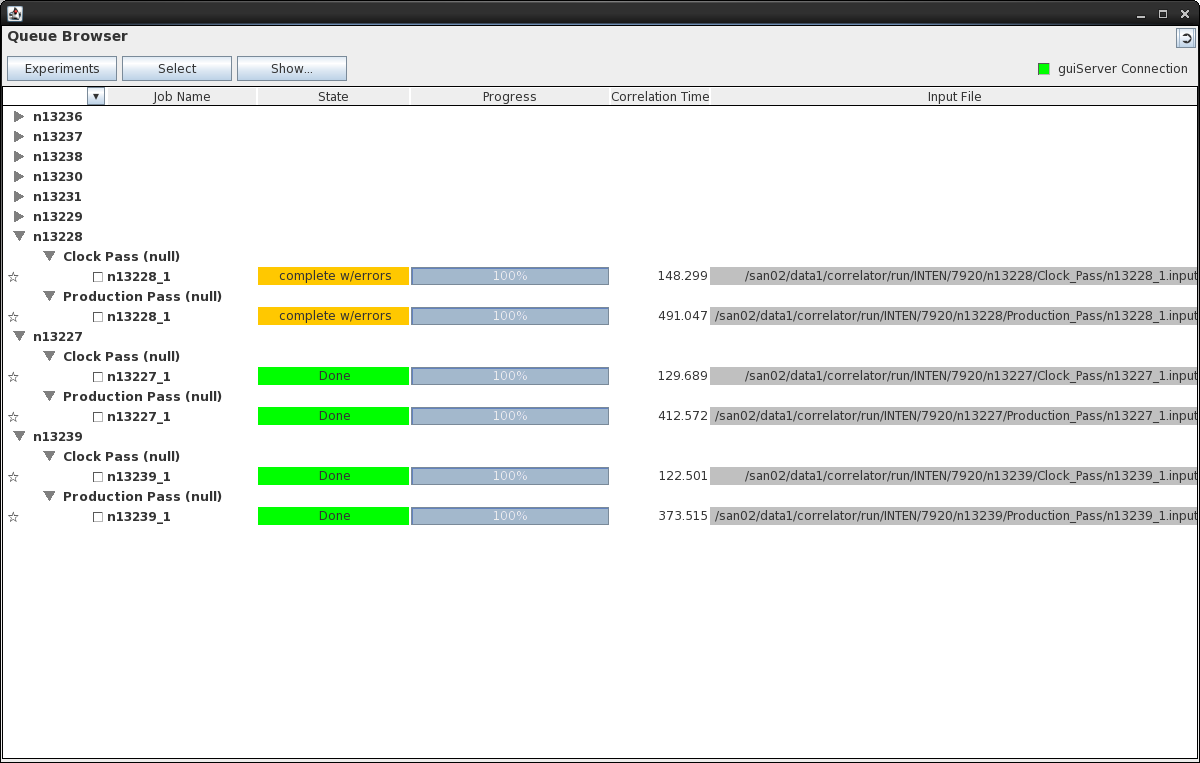
between sessions). In addition both the Queue Browser and
the Hardware Monitor have "tear-off" buttons that allow them to
become separate windows (they can also be re-attached using the
same buttons).
Queue Browser
The Queue Browser displays information about DiFX jobs - jobs that
are processed by DiFX and jobs that the GUI user has specific
interest in. Controls can be launched from jobs listed in the
Queue Browser to start and stop DiFX processing of them, edit their
properties, monitor their progress, or simply learn detailed
information about them. The browser provides tools to allow
you to create, delete, edit, and move experiments, passes and jobs.
The
"Browser" Part: Experiment/Pass/Jobs List
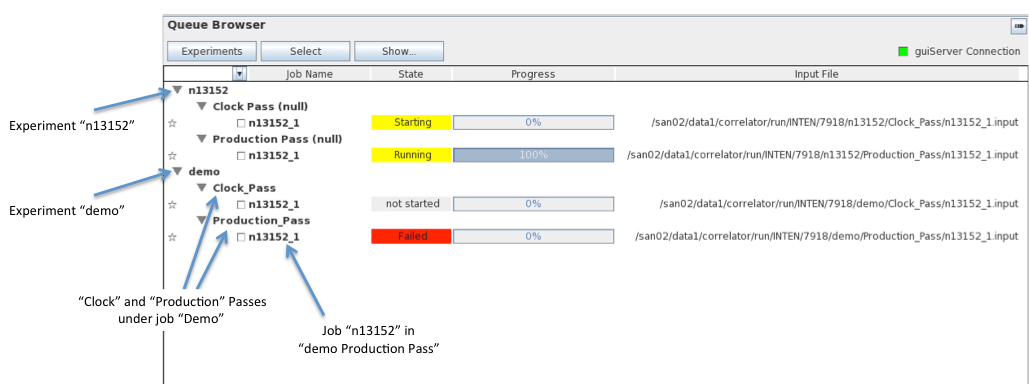
The Queue Browser organizes DiFX activities in a hierarchy of
"experiments", "passes", and "jobs", an organization that is
mirrored in the directory structure on the DiFX host. At the
highest level the Queue Browser contains a list of experiments, each
of which can contain any number of passes, within which are a number
of jobs. From the bottom up, each job exists in one and only
one pass, and each pass exists in one and only one experiment.

Experiments
An "experiment" is based on a single set of observations as
contained in a single .vex file. It has a set of
defined data sources (modules, files, or active e-transfers), and a
working directory location associated with it where all associated
files and sub-directories reside. It contains one or more
passes.
Passes
A "pass" contains a subset of the "scans" or "jobs" in an
experiment, along with a .v2d file containing the parameters
that make the pass unique within the experiment. The .v2d
file is created by the GUI based on the settings in a series of menu
options and fields. Each pass has a sub-directory
associated with it under the directory of its parent experiment
containing the .v2d file, the .input
files associated with each job in the pass, and any results
generated.
Jobs
Each job can be used to run a single DiFX correlation process.
A job has an .input file associated with it,
contained in the sub-directory of its parent pass. All of the
jobs in a pass are generated from the .v2d and .vex
files using vex2difx,
which produces the .input files. Jobs can be run
individually, or in groups.
"Experiment" and "Pass" listings in the browser can be "closed" to
reduce clutter (click on the little arrow).
Each menu item - Experiment, Pass, or Job, has a control menu
associated with it - these menus can be generated by right-clicking
on the line containing the item. Details on each follow:
Experiment Menu
- Select All Jobs/Unselect All Jobs: can be used to add
or subtract all jobs in the experiment from the selection
scheme, which is described here.
- Edit Properties: This is probably the most useful
item in this menu. It will bring up the Experiment Editor
for this experiment, pre-filled with values appropriate for
this experiment. It can be used to generate a new pass
with new jobs.
- Delete Selected Jobs: This will delete any jobs
within the experiment that have been "selected".
- Delete Experiment: The second most useful item.
The experiment will be hunted down and removed wherever it
exists - on disk on the DiFX Host, in the database if that is
being used. There will be no more experiment. Use
with care.
Pass Menu

- Select All Jobs/Unselect All Jobs: can be used to add
or subtract all jobs in the pass from the selection scheme,
which is described here.
- Rename: This option simply changes the name of the
pass. Apparently at some point in the GUI development
process this ability was felt to be important enough to merit
a button.
- Set Type: Another historical button. This
changes the "type" of the pass, which has no effect on
processing.
- Delete Selected Jobs: This will delete any jobs
within the pass that have been "selected".
- Delete Pass: This removes the pass from the browser
and deletes any directories and files associated with it on
the DiFX host.
Job Menu

- Controls for [Experiment Name]: Launch the Job
Control Window for this experiment. This window can be
used to control the start parameters of the job, start and
stop it, and monitor it. Described in detail here.
- Real-time Job Monitor: Launch a Real-time Monitor
Window for this job. The real-time monitor is described
here.
- Toggle Selection: Select the job if it is not
selected, un-select it if it is selected. Selections are
described here.
- Delete: Completely delete the job and all of its
associated files. This process cannot be reversed.
- Start: Start the job using existing settings (this is
equivalent to opening the Job Control Window and just hitting
"Start" without changing anything).
- Stop: Attempt to stop a running job. Sometimes
this works, sometimes it doesn't.
Job Information
While the "Experiment" and "Pass" lines in the browser contain
little more than the names assigned to them, the "Job" line
contains detailed information about each job. The Job
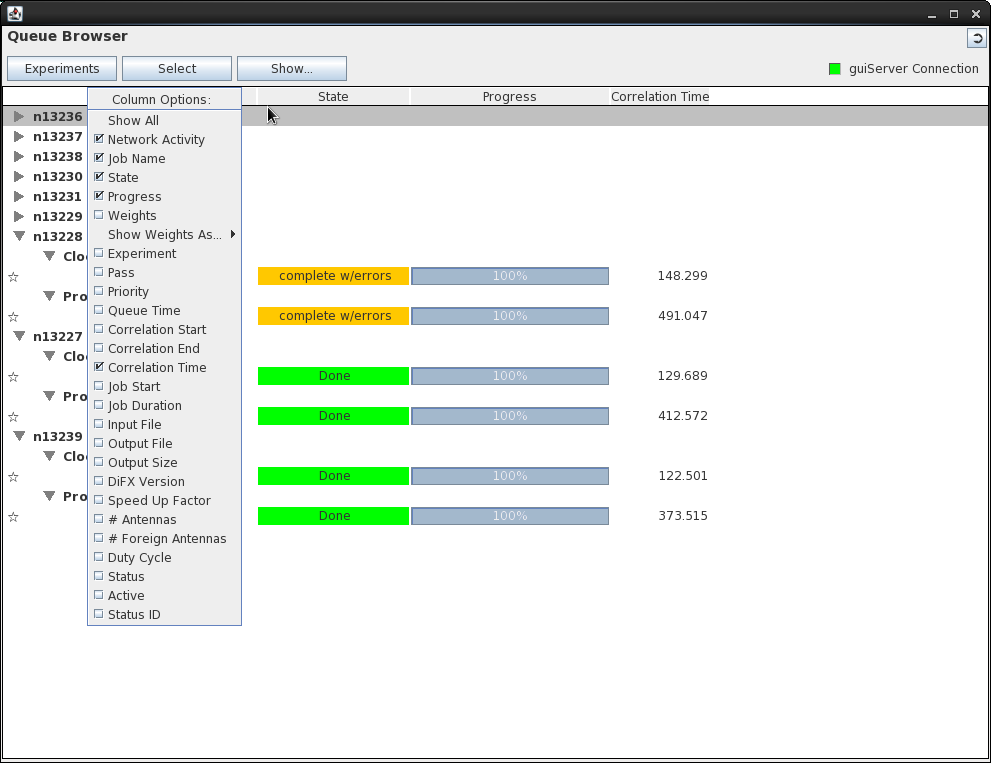
information is organized in columns that can be manipulated using
the column header at the top of the browser field. Columns
can be resized by clicking and dragging the boundaries between
them, removed using the small "delete" buttons that appear when
the mouse hovers over them, or information columns can be added
using the header menu. To generate the header menu, right
click on the header line or push the arrow button on the left side
of the header line:

Many of the possible fields simply reflect information that is part
of messages supplied by DiFX - they will only be updated when the
job is running and many of them are not used. Among the more
interesting/useful items are:
Network Activity
Network Activity is in the form of a small "light" box that
flashes green when any messages associated with the job are
received.
Job Name
This is the name given the job when it was created. The
name is usually automatically generated by vex2difx.
Names are unfortunately sometimes redundant - two passes in the
same experiment may repeat the same names. To make matters
more inconvenient, messages from DiFX are associated with a job
using the name, so occasionally the GUI may attribute a message
from one job to another.
State
This is the current state of the job - whether it has been run,
whether it had errors when it was run, whether it is still
running, etc. The GUI makes some effort to make the state
something sensible, with background colors that are appropriate.
Progress
If a job is running, the progress bar will show how far along
it is. Progress is computed based on the time stamp of the
visibility currently being processed compared to the start and
stop time stamps of the job. Whether this is completely
accurate is open to debate.
Weights
Weights show the relative weights of each antenna involved in a
job as it is processing. Weights can be displayed as
numbers or as time-series plots.
Correlation Time
This is the approximate "wall clock" time that a job required
to correlate. It is updated whenever a message for a job
is received from DiFX and is calculated from the time the job
was started.
Input File
The input file field contains the full path to the input file
on the DiFX host, and is the only unique way to identify a
job. This field is filled by the GUI and is not contained
in the messages from DiFX (which is unfortunately because it
could be used to uniquely identify the job associated with
them).
Adding Jobs
to the Queue Browser: the Experiment Button
There are a number of ways to add a job to the Queue
Browser. At a very basic level, the only thing required to
add a job is the location of a DiFX .input file.
The GUI uses the full path of the .input file to
uniquely identify a job (since it is, unlike the job "name",
guaranteed to be unique), and the contents of the .input
file to fully describe the job. The Experiment Button on the
Queue Browser provides the following ways to obtain and .input
file, and thus add a job to the visible queue:
Create New: Create A Job From Scratch
A completely new job or list of jobs can be added to the queue
based on a .vex file and a few user settings. The "Create
New..." button will launch the Experiment Editor,
which will lead the user through the process of creating new
experiments, passes, and jobs.
Locate on Disk: Find Existing Experiments on the DiFX Host
The Queue Browser has the ability to locate previously-created
experiments on disk (via the head node) and adding them to the
queue. It does this by locating .input files,
one of which should exist for each existing job on disk.
Assuming an .input file is intact and properly
formatted the GUI can extract all information about its
associated job, edit that information, and run the job.
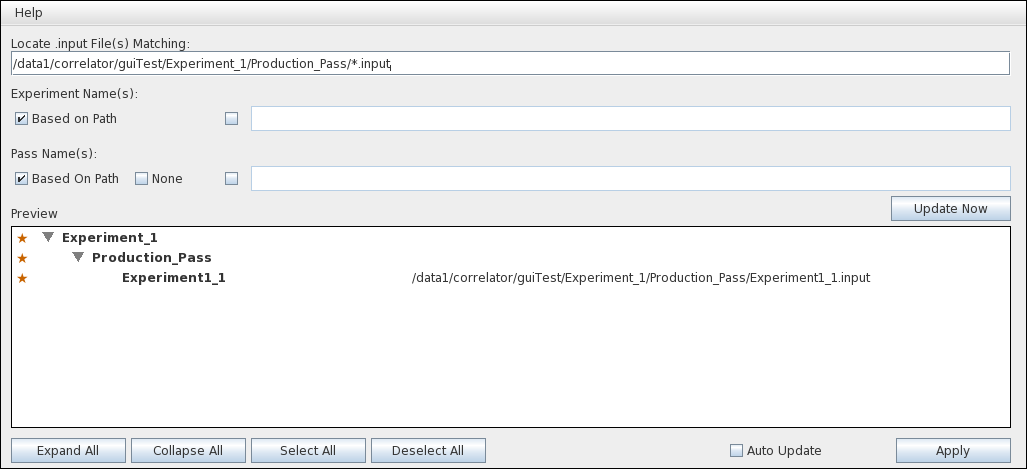
The Queue Browser panel provides a tool for locating .input
files on disk using the "Locate on Disk..." option under the
"Experiments" menu:

The "Experiment Location" tool provides a field for defining
the directory path of .input files (the field accepts
standard "ls" wildcard rules). Each .input file is assumed
to represent a job. Options are provided for defining the
names of experiments and passes associated with the found
jobs. A preview of all jobs that meet the defined criteria
is given - hitting "Apply" will put these jobs in the Queue
Browser experiment queue. A detailed description of each
field/option/button is below:
Locate .input Files Matching...
This field allows you to specify the directory path for a
"search" for the .input files you are interested
in. The field supports tab-completion, and allows "ls"
style wildcards. When you hit "enter" in this field a
search will be made on the DiFX host for any files that
match. These files are then displayed with their
corresponding experiment and pass structure in the "Preview"
area. Note that .input files always end with
".input".
Experiment Name(s)
The Experiment Name determines the name that will appear on
the Queue Browser. By default this is based on the
directory path on the DiFX Host.
Based on Path
Select this option to keep the name of the experiment
directory.
Specified Name
Select this option to specify your own name (which you do in
the accompanying text field). Changing the name only
changes the Queue Browser - it will not change the directory
name on the DiFX host.
Pass Name(s):
Similar to the Experiment Name settings, the name of the pass
that appears on the Queue Browser can be changed.
Based on Path
The default - use the directory path for the pass on the
DiFX host as the name.
None
This option is used if there isn't a separate pass
directory. Behavior is a little weird if there is
one. Needs to be fixed.
Specified Name
Specify your own pass name.
Preview
The Preview window shows the (approximate)
experiment/pass/job structure that will be added to the Queue
Browser when the "Apply" button is clicked. Individual
items can be selected or de-selected from it by clicking on
the colored symbols at the extreme left of each line - only
selected items will be added to the Queue Browser.
Update Now
This button will perform a new search on the DiFX host based
on your search criteria and display the results in the Preview
field. Hitting enter when changing text fields does the
same thing, so this button is redundant.
Auto Update
Not implemented yet.
This option will trigger a periodic search of the disk for
new jobs using the rules specified in the window. Any
changes to the list of experiments and jobs that meet the
search criteria will be reflected in the Queue Browser - jobs
that are deleted will be removed, new jobs that are created
will appear, etc. This is only necessary if you want
to see changes made by other people (i.e. other instances of
the GUI) in real time - the Queue Browser will show any
changes you make without this option being chosen.
Unless you expect remote changes to be made and wish to see
them you should probably not pick this option as the searches
are resource-consuming.
Apply
The Apply button will instruct the GUI to download the
information for the selected experiments/passes/jobs in the
Preview window and add them to the Queue Browser. The
jobs can then be correlated.
Locate in Database: Obtain a Job From the Database
If you are using the DiFX data base structure (see DiFX
GUI and the Database), previously stored jobs can be
downloaded based on their names, properties, or completion
state.
Note: it has been a long time since any maintenance of the
GUI/Database interaction has been done, and it may not work all
that well.
Monitoring a Job Running Elsewhere
All jobs that are running (i.e. being processed by DiFX) while the
GUI is active produce multicast diagnostic messages detailing
their progress. The GUI (assuming it is set correctly to
monitor multicast traffic) will collect, interpret, and display
the content of these messages in the Queue Browser. If the
job generating the messages is known (already listed in the Queue
Browser), their content will adjust the appropriate job entry in
the Queue Browser display. If the job is not known a
new entry will be created. New entries of this sort will
lack complete detail because their associated .input
file will not be known (its identity is not contained in the
multicast messages). Also the GUI will only be able to
monitor these jobs, not stop or start them (this makes some sense
- any job listed this way was started elsewhere, so presumably
belongs to someone else). Jobs of this type appear under the
heading "Jobs Not In Queue" (maybe that will be changed...).
Select Button
The Select scheme is one of those ideas that seemingly had
promise once, but is now little used. It has not yet been
abandoned, partially because it might one day become useful, but
mostly because it is harmless and what little it does do works
fine.
A job is considered "selected" if the little star character on
the extreme left of the job line in the browser is colored.
Any job can be selected or un-selected by clicking on this
character. Jobs can also be selected or un-selected en-masse
using menu options. The Select Button was meant to provide a
number of things that could be done to all of the jobs that were
currently selected, however about all you can do right now is
delete them (which works). You can also select and un-select
them all.
Show Button
Probably even less functional than the Select Button, the Show
Button was meant to allow the user to choose what types of jobs to
display. In particular, it was meant to allow jobs to be
displayed by "state" - i.e. whether they had been run, completed,
archived or whatever. This is probably a good idea,
ultimately, but is not yet implemented. The options under
the Show Button do nothing at all.
GuiServer
Connection Monitor
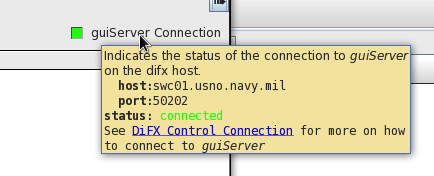
The guiServer Connection Monitor provides the status of
the current connection to the guiServer - if it is green
all is well, if it is red then the connection is broken. It
was placed in a prominent location on the Queue Browser because
this browser serves as the "front page" of the GUI, not because it
had anything to do with the rest of the contents.
The guiServer Connection Monitor has a fairly advanced "tooltip"
that lets you know more about the current connection. Hover
over the monitor to generate it.

Running Jobs
With the Scheduler
Skipping Missing
Stations
In large experiments with many stations and many jobs, it is
not uncommon for a station to "drop out" of observations for
which it is scheduled for any number of reasons. While not
ideal, for a multi-station job this situation should not be a
deal breaker, as long as enough stations remain to form at least
one baseline. The Job Control Monitor offers the user the
ability to remove
stations from an experiment by hand (whether they are
missing or not!). Depending on the value of the "Try
To Skip Missing Stations" setting in the Setting Window,
the scheduler can be made to do this automatically.
While the scheduler will skip missing stations automatically
and with apparent ease, the process is not simple. It
involves creating a new, job-specific .v2d file, running
vex2difx, and producing a duplicate list of output files.
The details of this process are outlined here.
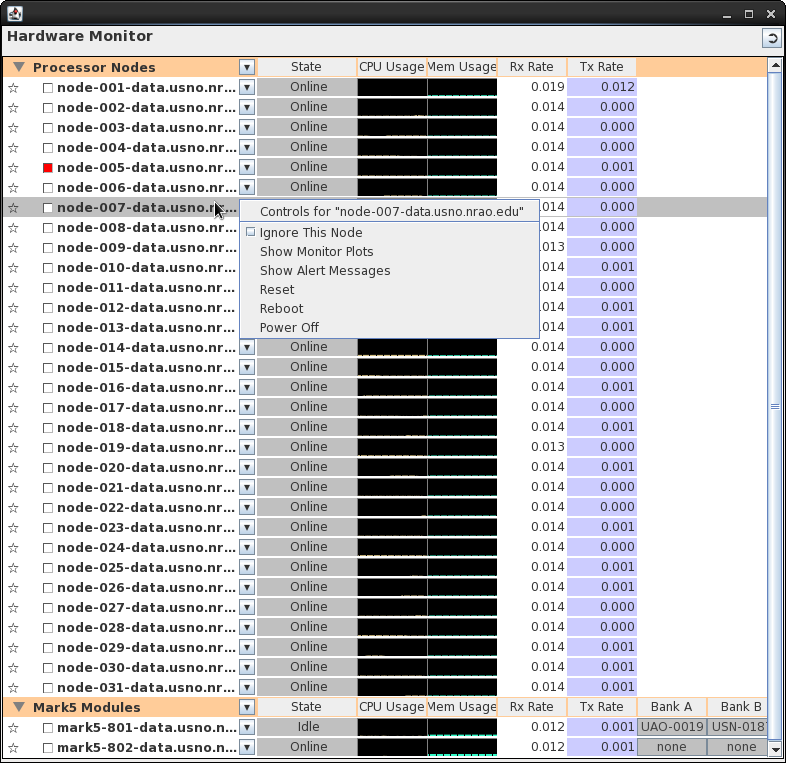
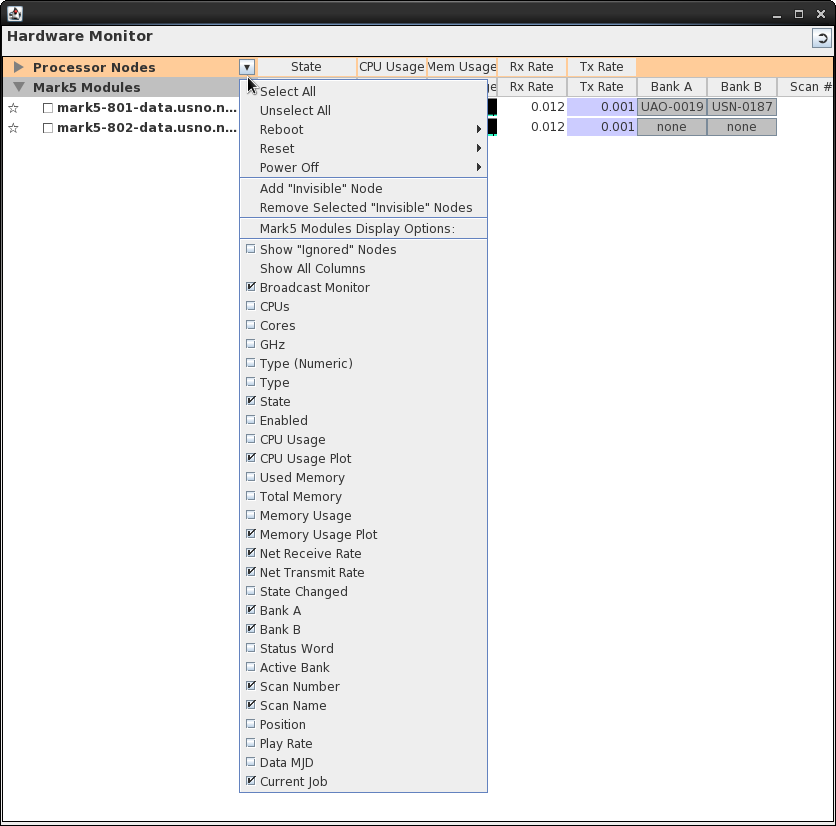
Hardware Monitor
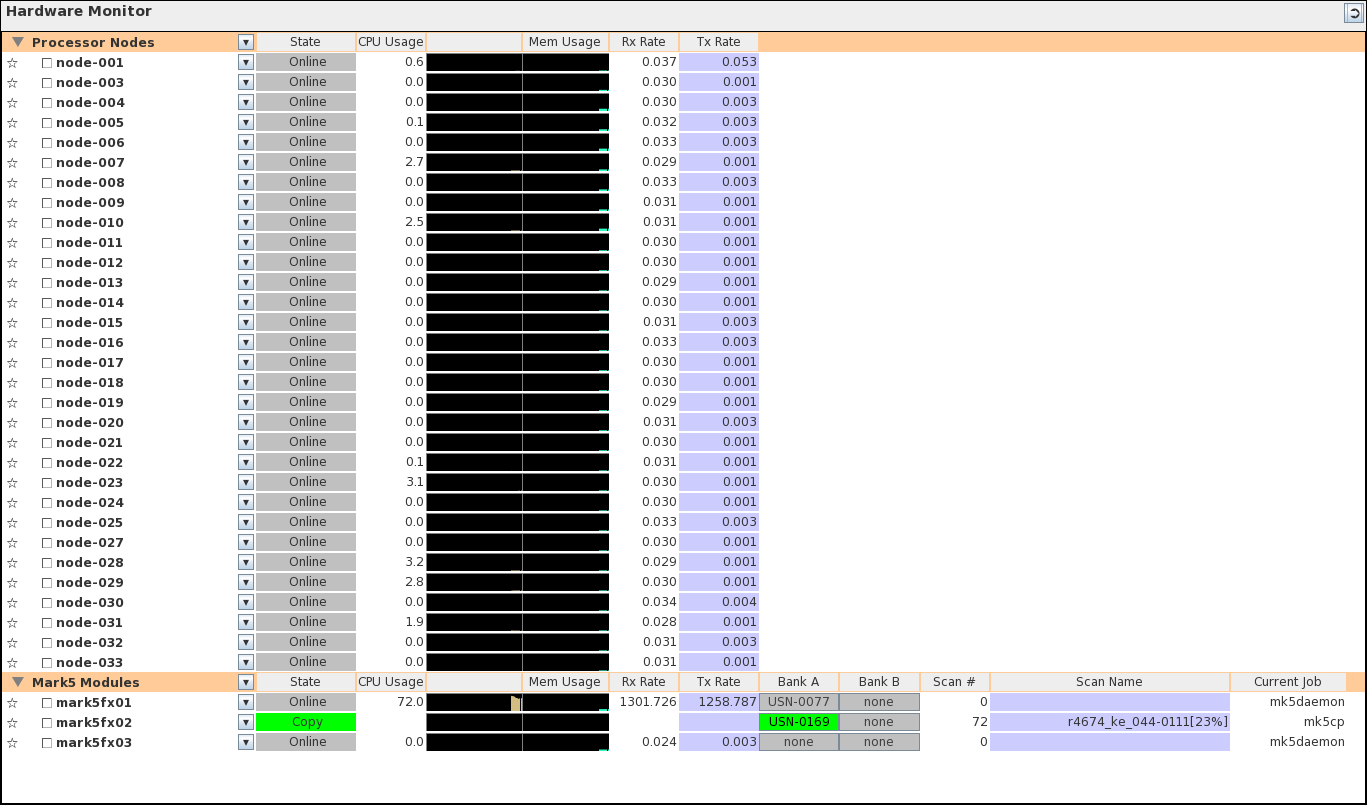
The Hardware Monitor shows all of the nodes in the
DiFX correlator that are running mk5daemon to periodically
broadcast, via UDP multicast messages, their current state (this
is done using "Difx Load" messages from all nodes and "Mark5
Status" messages from Mark5's). The UDP broadcast messages
are captured by guiServer and then relayed to the GUI
using the GUI/guiServer TCP connection. Each node
detected via these messages is listed on its own line in the
Hardware Monitor (the GUI identifies the nodes by their host
name...if the name changes for some reason a new line will appear
in the Hardware Browser). The GUI tries to determine whether
a message comes from a Mark5 or a regular processing node based
either on the message type ("Mark5 Status" messages are assumed to
be from Mark5's), or based on a list of name specifications that
the user sets in the GUI Settings ("Identify
Mark5 Unit Names by Pattern"). Any node that is not
identified as a Mark5 is assumed to be processing node.
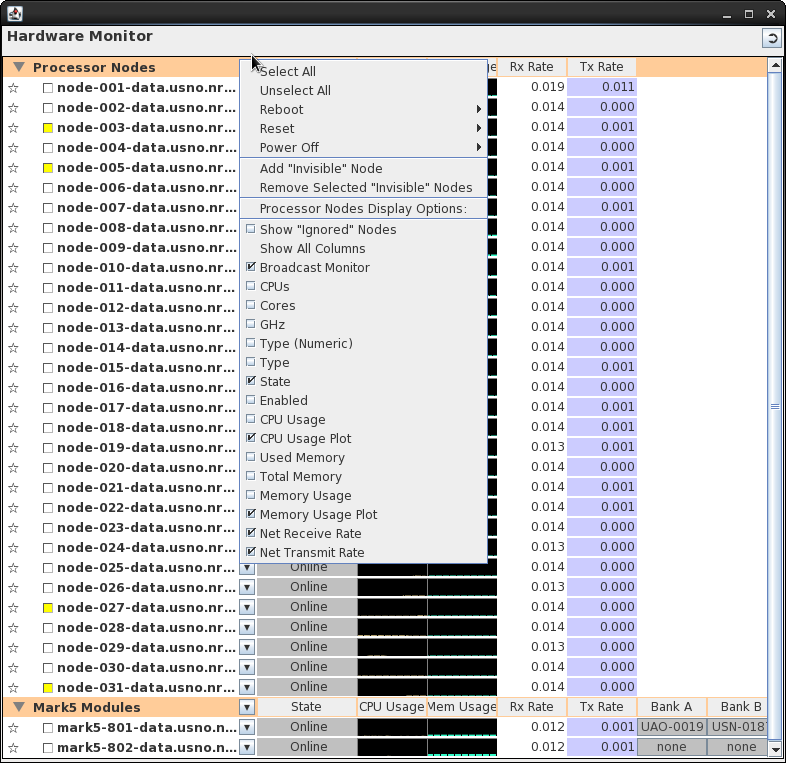
Each node, processor or Mark5, has three fields that
are always displayed, a "selection" icon, an activity light, and
the node's name. The selection icon is used to perform
functions on more than one node at a time as described below. The
node name is generated by guiServer based on what it
thinks is the source of the message - this name may or may not
match what the platform you are running the GUI on uses (it is
critical that these names be correct from guiServer's
point of view as they are used when instructing guiServer
to perform functions on specific nodes). A node's activity
light will blink green when a mk5deamon message is
received for it. If no messages are received for a node for
a period of time the light will turn yellow, then after another
period of time it will turn red, indicating a possible problem
with the node. These periods of time are essentially
arbitrary and may need to be adjusted to the peculiarities of your
own installation. See Inactivity
Warning/Error Settings.


Functions
Performed on "Selected" Hardware

Working With Mark5 Data
Mark5 nodes are used to read (and otherwise manipulate) Mark5 data
packs. When data packs are installed on a Mark5 node, their
"VSN" identifiers will appear in the GUI under the "Bank" in which
they are installed (A or B). For each populated bank the user
can examine "S.M.A.R.T." (Self-Monitoring, Analysis and Reporting
Technology) information, which provide indications of the
reliability and overall health of the data drive, and the scan
"directory" of the data module contents, which is used by DiFX when
reading data from the drive. There are two ways of getting at
these data. The pop-up "control" menu for the Mark5 will
contain an entry for each populated bank that leads to a submenu:

In addition, left-clicking on the VSN name will produce the same
sub-menu:

S.M.A.R.T Display
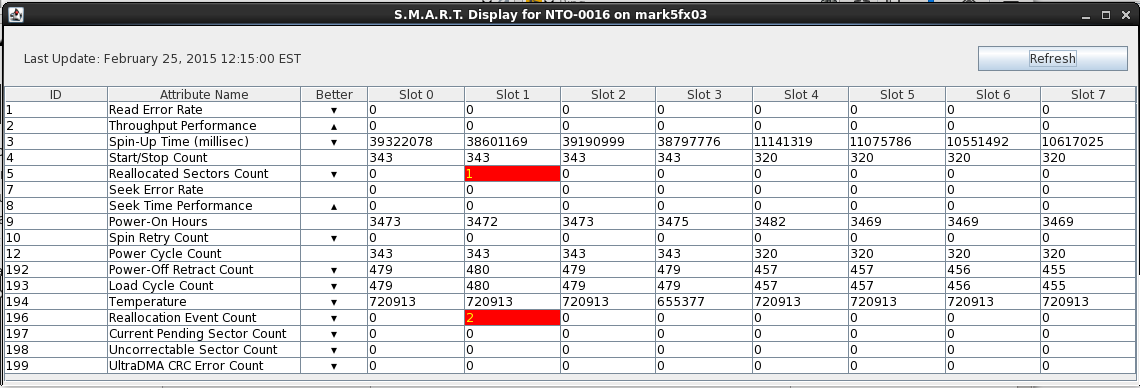
The S.M.A.R.T. Display can be used to examine the S.M.A.R.T.
information available for the hard drives that make up a Mark5
module. These data are generated by a request to the
appropriate Mark5 node via a mk5control command (new data
can be generated at any time using the "Refresh" button).
For each S.M.A.R.T. parameter the display shows an ID, name, and
values for each "slot" containing a component hard drive, as well
as an indication of whether higher or lower values are
"better". Values that are considered troublesome are
highlighted in red (the "troublesome" thresholds are hard-coded,
but may ultimately be added to the Settings). A good
description of S.M.A.R.T. parameters is contained in the relevant
Wikipedia
entry.

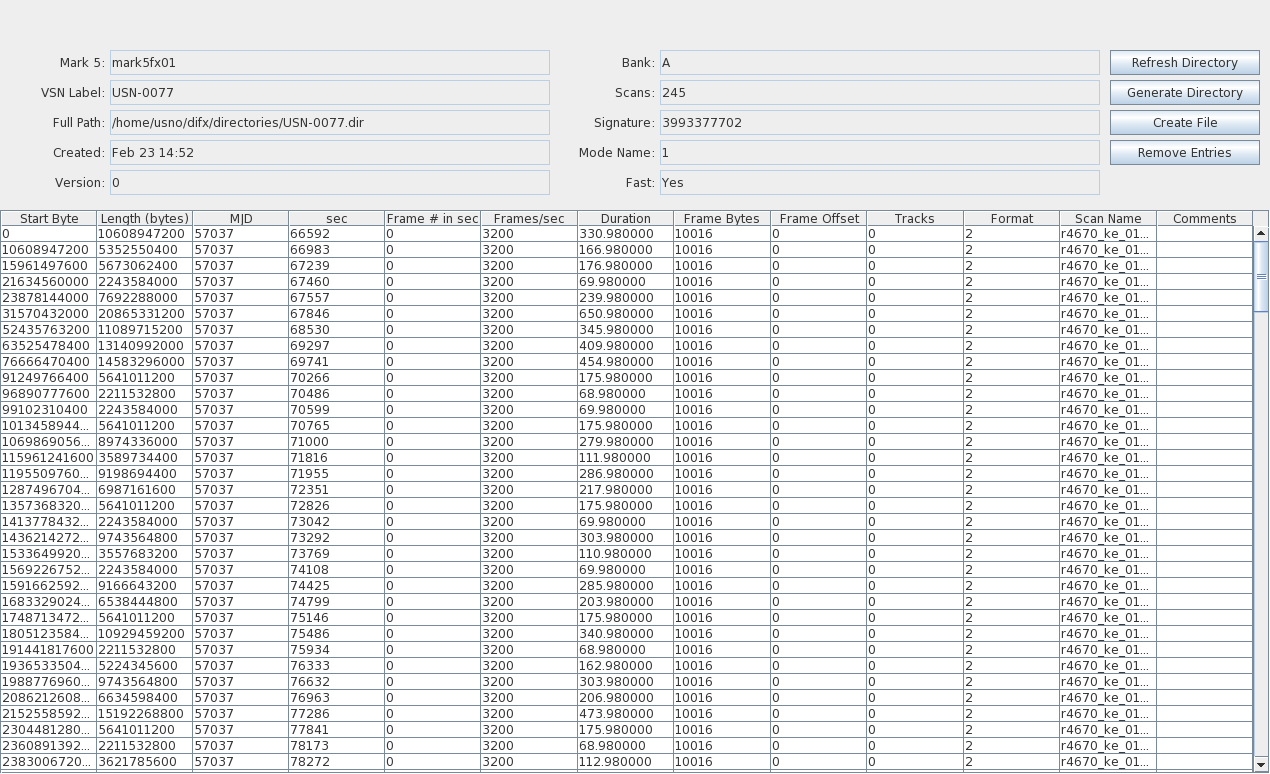
Module Directory
The Module Directory display shows detailed information about the
scans contained on a module. These data are stored in a
"directory" file, accessible to the Mark5 node, in a path set by
the MARK5_DIR_PATH environment variable (ideally this variable
should be identical for all nodes in a DiFX cluster, but the
Module Directory actively queries the Mark5 node to see what it
thinks it is). This directory file may or may not exist - if
it is missing it will be quite obvious, as no data will be
displayed in the Module Directory.

The Module Directory buttons can be used to do a number of things:
Refresh Directory will cause the existing directory (if there
is one) to be read and displayed. When the Module Directory
window is first opened this is done automatically.
Generate Directory will cause the Mark5 node to survey the
module and produce an entirely new directory. This needs to be
done if the directory is missing, as without it DiFX can do nothing
with Mark5 module data. The process takes a while - the Module
Directory display will update progress on a fairly regular basis.
Create File is used to copy scan data from the Mark5 module
to disk. The scans that you wish to copy should be selected
first (by clicking on them - shift/click can be used to select
regions). You will be prompted for a destination directory -
the Mark5 node must have write access to this area. Each scan
is put in its own file. This can be a very slow process if
many scans are copied, but useful progress information is provided.
Remove Entries provides a rudimentary editing capability for
the directory. Under some circumstances Mark5 module
directories can contain "false" scan entries that make them unusable
by DiFX. This button will remove all selected entries from the
directory. Any erroneous removals can be "repaired" by
generating the original directory again and starting over.
Message Window
blah blah blah
