| Version 12 (modified by , 15 years ago) (diff) |
|---|
Reducing CABB Data
An example
This page will walk through the reduction process for the ToO observation CX167, which was observed on 16 Feb 2009 with the interim CABB system. This system had 5 antenna dual pol, 1 IF at 6/3cm, but not all 2048 continuum channels were working.
First, make sure you have the CABB version of MIRIAD, otherwise this will not work!
To do this on kaputar, make sure that /nfs/atapplic/miriad-cabb/linux64/bin is in your path ahead of any other MIRIAD directories. To check that
this is so, in a terminal, type which atlod. It should return /nfs/atapplic/miriad-cabb/linux64/bin/atlod.
Then source /nfs/atapplic/miriad-cabb/MIRRC. You should now be using the CABB version of MIRIAD.
To begin with, the reduction is the same as any other pre-CABB dataset, and we start by using ATLOD to read in the data.
We have four files for CX167: 2009-02-16_0658.CX167, 2009-02-16_0701.CX167, 2009-02-16_1651.CX167 & 2009-02-16_1824.CX167.
atlod in=*.CX167 out=cx167.uv ifsel=2 options=birdie
Here, we use ifsel=2 because only 1 IF was available with the interim CABB system and it was written as IF 2.
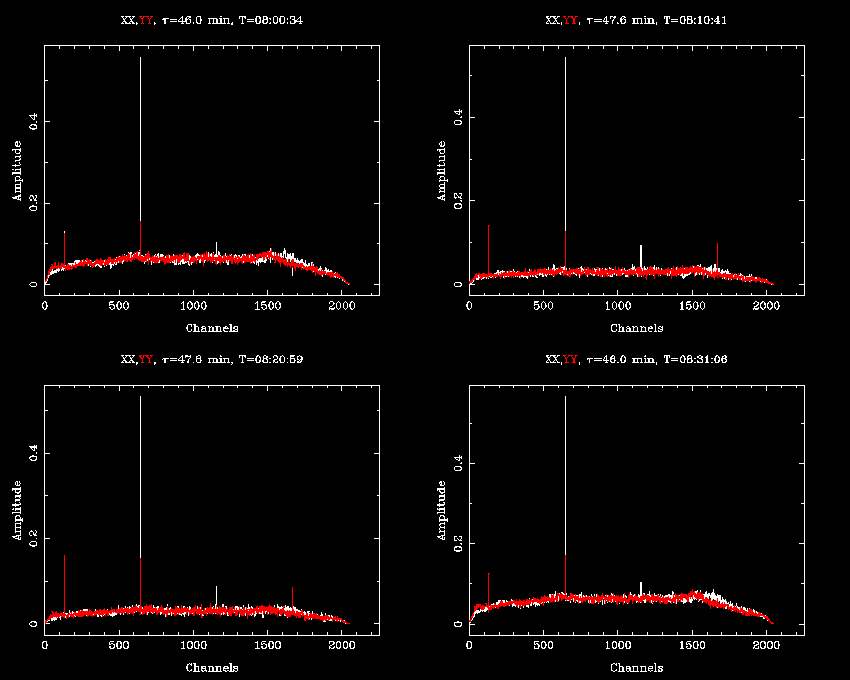
At this point, we can see what the CABB spectrum looks like with uvspec:
uvspec vis=cx167.uv "select=pol(xx,yy)" interval=10 options=nobase,avall axis=chan,amp device=/xs

We want to calibrate the bandpass. Luckily there is some 1934-638 data, so we calibrate our bandpass with that:
mfcal vis=cx167.uv "select=source(1934-638)" interval=0.1
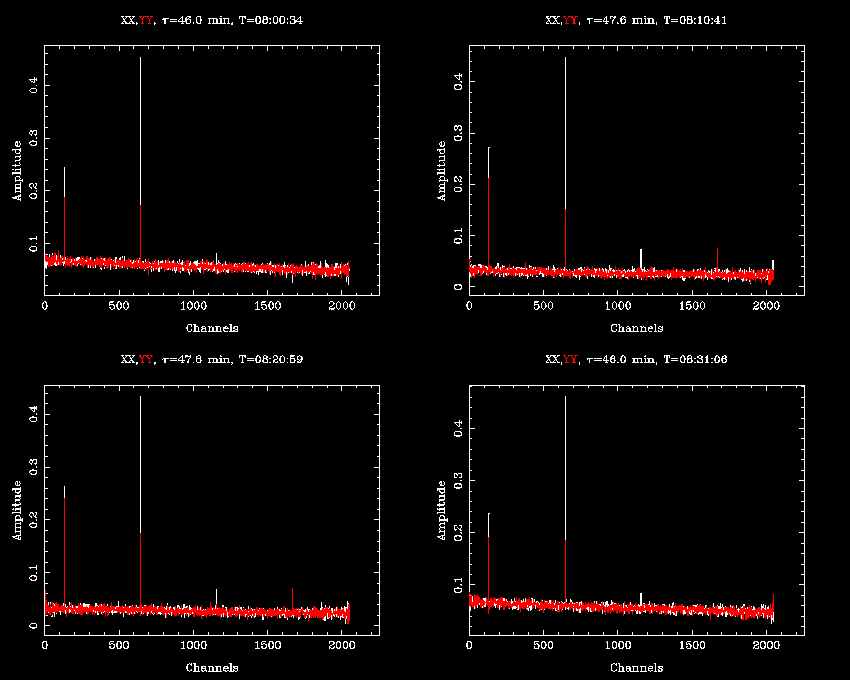
Giving the same uvspec command as before we now get:

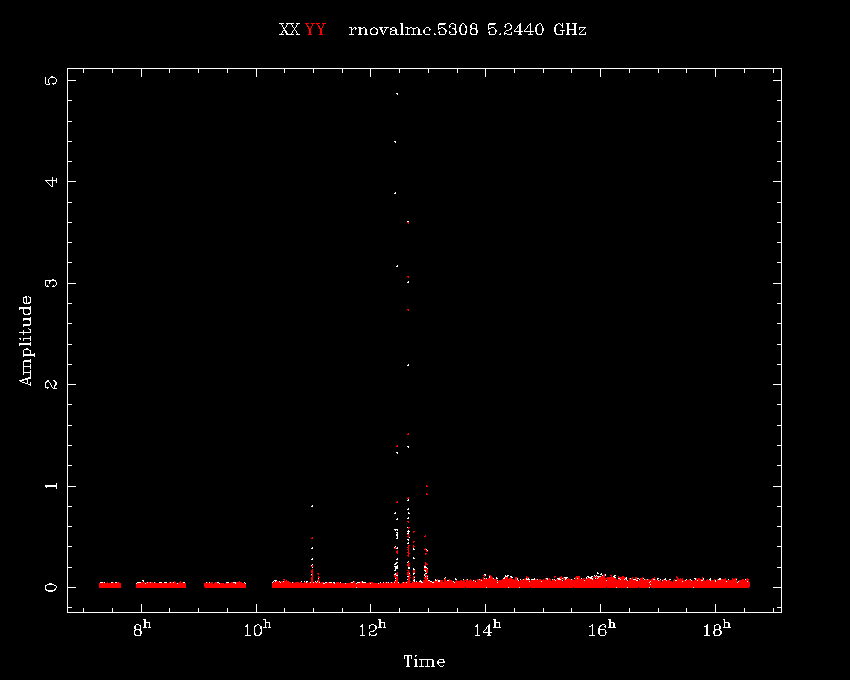
There is some obvious narrowband interference present in the data. With CABB's polyphase filter design, the channels are designed to be very sharp-edged, so most interference will be present only in one channel, even if it is very strong. This should allow us to very effectively excise this RFI with an automated routine.
One option is to use Pieflag, Enno Middleberg's automatic flagging script. It works by looking at each channel in turn through time, and finding outliers in comparison to a channel that is known not to have RFI. This works quite well for continuum datasets from the old correlator, since there are fewer channels. Pieflag loads the entire dataset into memory, which can be quite a strain on a computer that does not have enough memory for the datasets that CABB will produce.
Another option is to use a script made by Jamie Stevens to look for narrowband RFI (which is attached to this page). This script looks for individual channels that deviate from the median by more than an acceptable amount.
To search the data for narrowband RFI, give the command:
cabb_nb_rfi_extractor.pl --doit --select-options "-auto,-ant(6)" --interval 10 --flagscript --vis cx167.uv --sigma 5
The script finds that there is interference in channels 5, 133, 645, 1149, 1150, 1157 and 1669. It makes another script
which contains the uvflag commands required to flag these channels, which can then be executed.
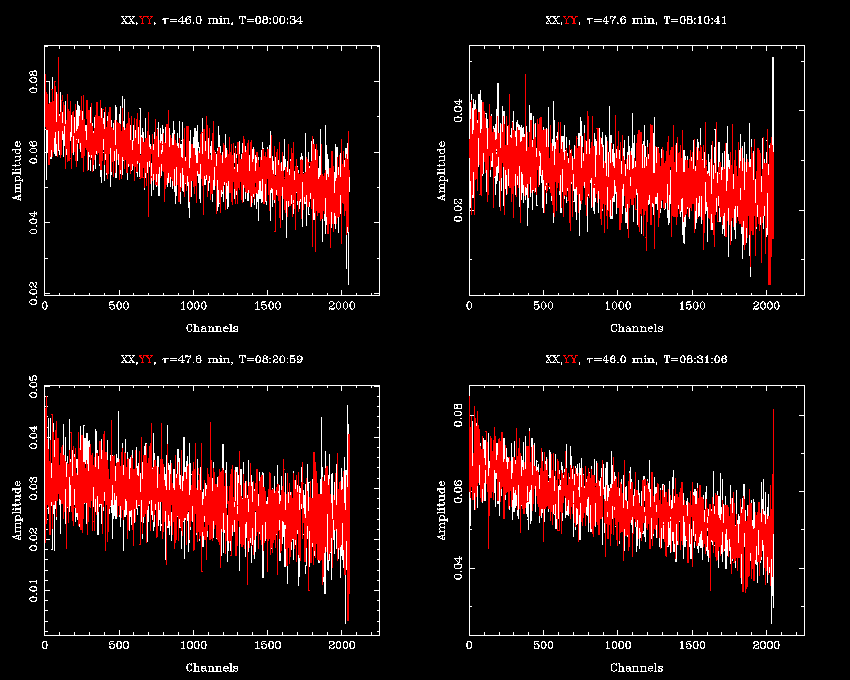
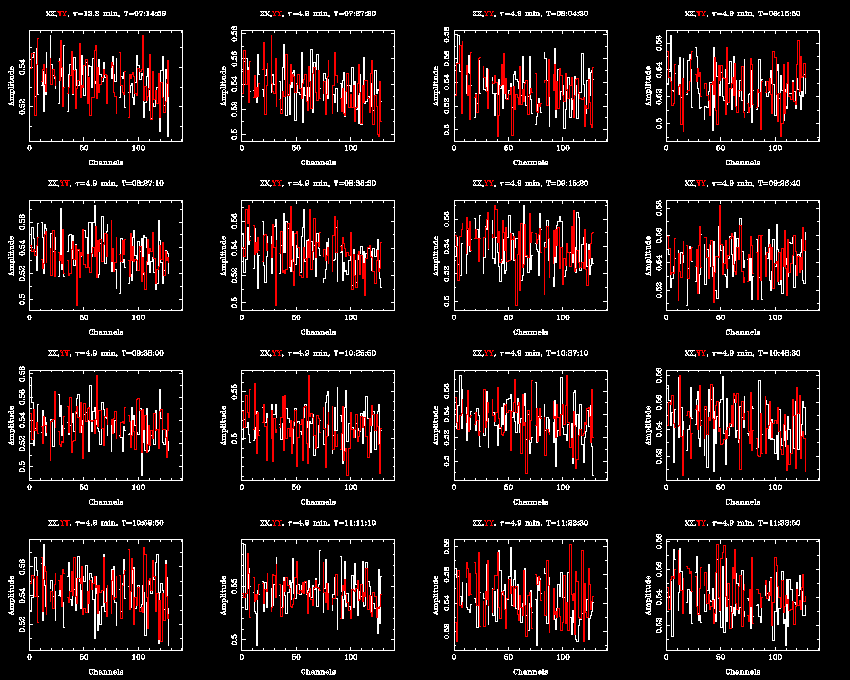
After flagging, the bandpasses look like this:

There seems to be higher noise levels towards the edge of the band, especially at the high channel end, so we use
uvflag to clip off 50 channels from each side of the bandpass:
uvflag vis=cx167.uv edge=50 flagval=flag
It should also be noted that the RFI detection script only flags RFI channels that persist throughout most of the
intervals that are examined. This behaviour can be changed by telling the script to flag each interval separately
(using the --nearby option, or by setting the --persistent flag to be a lower number than the default 30%.
The upshot is that at this point there is still some RFI present, ie. channel 513, during the first observations of 1934-638.
The next step is to recalibrate the dataset again after removing most of the RFI.
mfcal vis=cx167.uv "select=source(1934-638)" interval=0.1
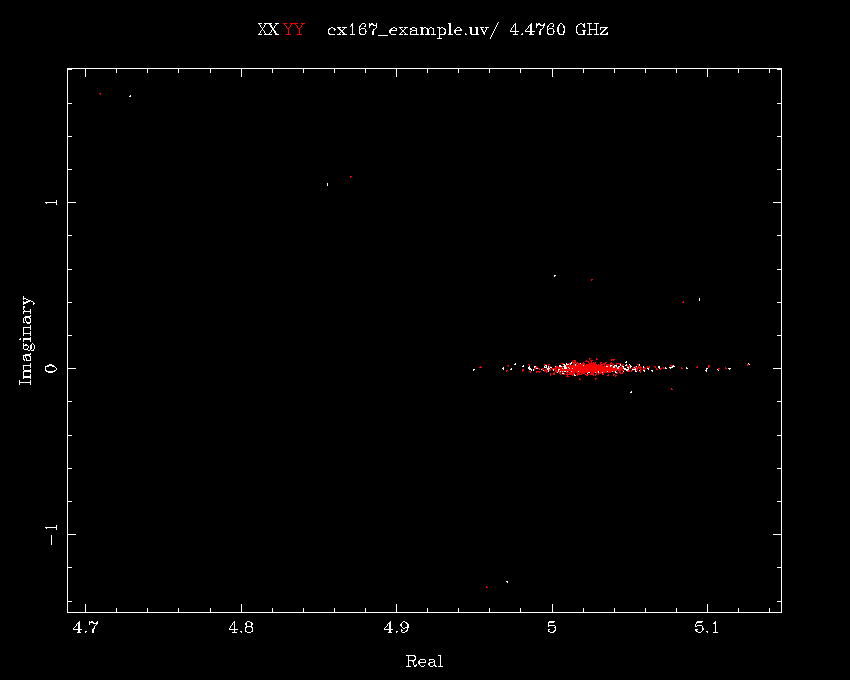
Let's look at the calibration of 1934-638.
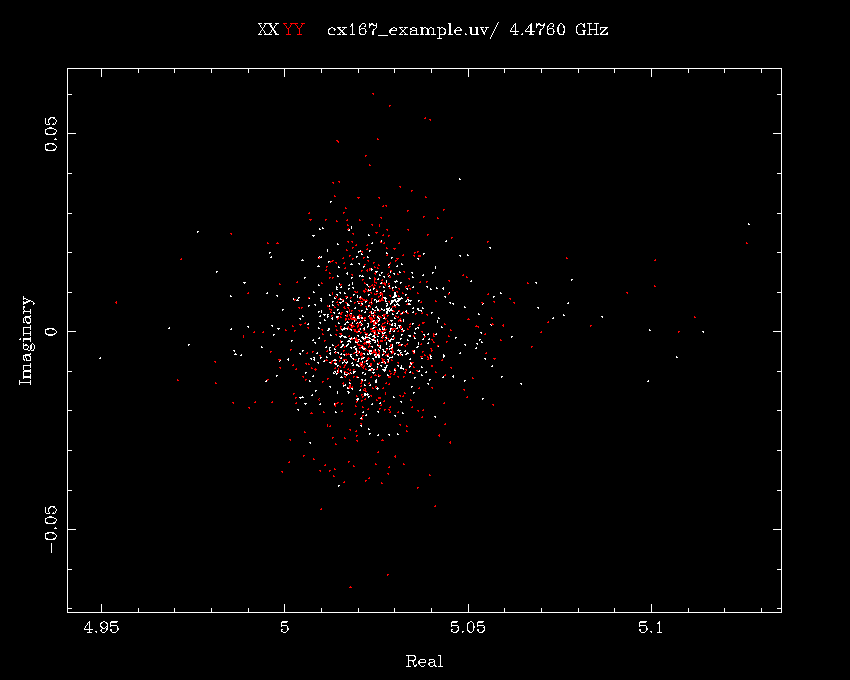
uvplt vis=cx167.uv "select=-auto,-ant(6),pol(xx,yy),source(1934-638)" axis=real,imag options=nobase device=/xs

It's not bad, but there are enough outliers to warrant a closer look. A time-phase plot shows the problem:
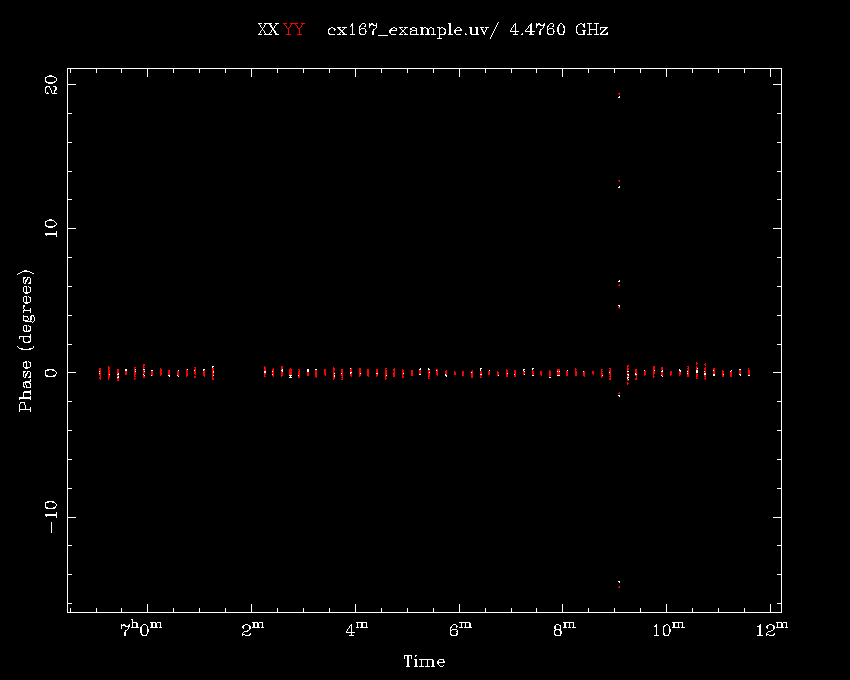
uvplt vis=cx167.uv "select=-auto,-ant(6),pol(xx,yy),source(1934-638)" axis=time,phase options=nobase device=/xs

The time between 07:09:00 and 07:09:10 has bad phases, so we flag this out:
uvflag vis=cx167.uv "select=time(07:09:00,07:09:10)" flagval=flag
and recalibrate as before. The real,imag plot now looks like this:
Attachments (11)
- cx167_example_plot1.png (11.0 KB) - added by 15 years ago.
- cx167_example_plot2.png (12.2 KB) - added by 15 years ago.
- cx167_example_plot3.png (18.2 KB) - added by 15 years ago.
- cx167_example_plot4.png (6.2 KB) - added by 15 years ago.
- cx167_example_plot5.png (6.5 KB) - added by 15 years ago.
- cx167_example_plot6.png (10.3 KB) - added by 15 years ago.
- cx167_example_plot7.png (26.0 KB) - added by 15 years ago.
- rnovalmc_rfi.png (6.8 KB) - added by 15 years ago.
- rnovalmc_4668_image.png (15.7 KB) - added by 15 years ago.
- rnovalmc_montage.png (110.0 KB) - added by 15 years ago.
- rnovalmc_m2_small_4668.png (22.5 KB) - added by 15 years ago.
Download all attachments as: .zip